The European Commission has this week published the financial allocations of Cohesion Policy to individual countries for 2014-2020. For a quick overview, we provide a few charts of the numbers below.
At the same time EU countries are getting into the nitty-gritty details of their programming for the coming period (the deadline for submitting the draft Partnership Agreement and Operational Programme to the European Commission is in October). During these months environmental campaigners have to be almost everywhere at once to make sure green spending and public participation aren’t sacrificed in the process.
The Latvian example shows that civil society participation and strategic environmental considerations are among the first to be let go in case of time and capacity constraints. The green potential of Estonia’s future agricultural policy is in danger of being hijacked by major agri-business interests. And lack of trust (among others) seems to be in the way of a better involvement of municipal and regional authorities in EU funds planning and implementation in Slovakia.
For more details on financial allocation and country eligibility see the European Commission’s website.
In connection with the climate earmarking, these figures are a key to determine how much money member states need to invest into climate measures. We will take a closer look next week how the numbers translate into absolute amounts earmarked for the transition towards a low-carbon economy.
Chart 1: Share of total Cohesion Policy allocations by country
Hover your mouse over a slice to see country name and the allocated amount in million EUR.
Chart 2: Total Cohesion Policy allocation by country (amounts in million EUR)
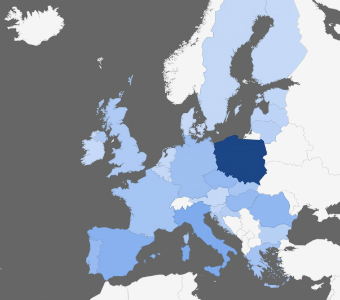
Chart 3: Map with colour-coding according to total allocated amounts
Hover over countries for more details (amounts in million EUR)
Never miss an update
We expose the risks of international public finance and bring critical updates from the ground – straight to your inbox.
Institution: EU Funds
Tags: Cohesion Policy | EU funds | EU regions | allocation | chart | legislative process | regional development | structural funds
