Between the hammer and the anvil
More than 90 per cent of Kosovo’s electricity generation comes from the two coal-fired power plants, Kosova A and Kosova B. But they are also the biggest polluters in the country and are responsible for most of the air pollution in the town of Obiliq, located between the two plants.
The latest Air Quality in Europe report from the European Environmental Agency ranks Kosovo as the country with the third-worst air quality in Europe. It is no secret that this is mostly because of the two coal-fired power plants, Kosova A and Kosova B, commonly regarded as the most polluting power plants in Europe. Every single report on air quality in Kosovo, from the country’s Annual Reports on the State of the Environment in Kosovo to the Healthier Kosovo report by the World Health Organisation (WHO) and the United Nations Development Program (UNDP), points to the power plants as the main source of air pollution.
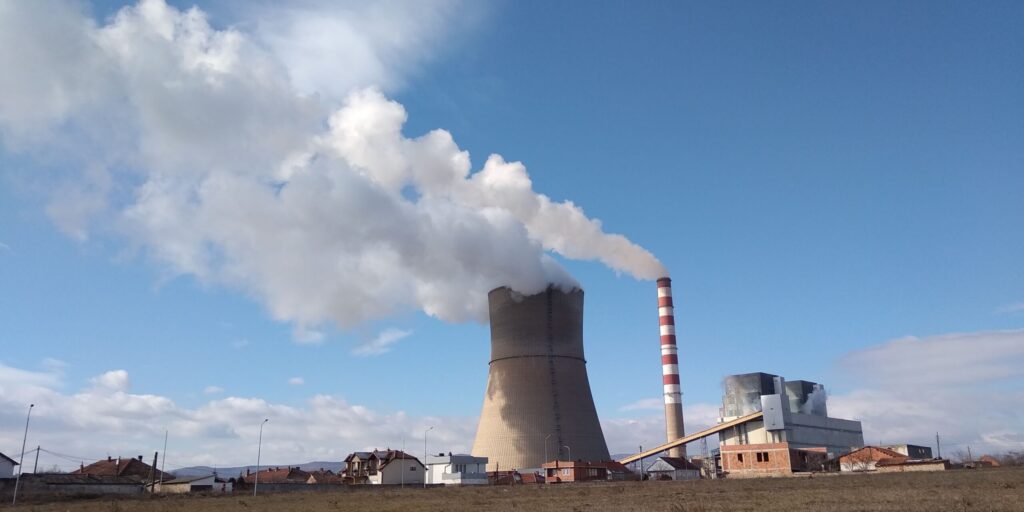
The health impacts of air pollution in Kosovo are enormous. A 2014 study by UNDP assesses that the crude death rate attributed to dust pollution is 6 deaths per 1,000 people annually. According to the Health and Environment Alliance, the annual health costs of the two power plants for the people of Kosovo and neighbouring countries are between EUR 70 and 169 million.
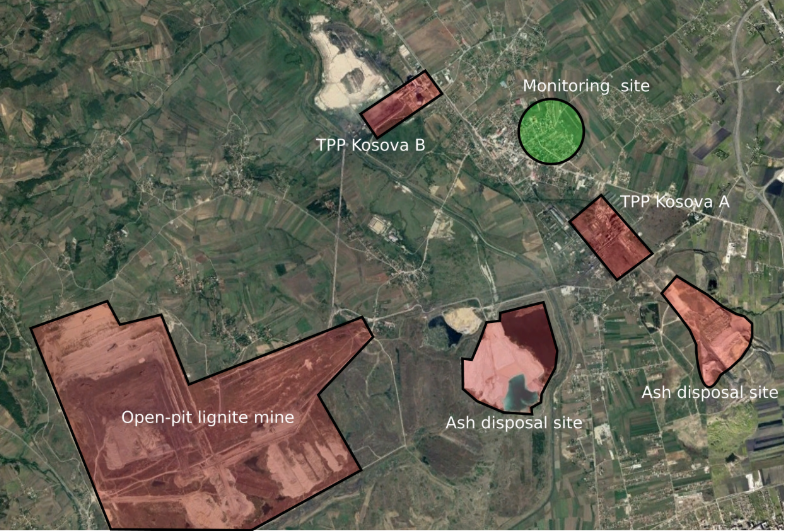
Both power plants are located in the town of Obiliq, with Kosova A on the south-eastern outskirts and Kosova B to the north-west. Together with the nearby ash landfills and open-pit lignite mines, the plants hammer Obiliq’s citizens with deadly air pollution all year long. As the Annual Report on the State of the Environment in Kosovo for 2017 concludes, in Obiliq ‘there were exceedances of MAV (Maximum Allowed Values) for PM10 and PM2.5 even in July, August and September, as a result of the emissions from the Thermal Power Plants Kosova A and Kosova B and other activities, such as extraction, hauling and storage of lignite.’
However, the monitoring station that reported these exceedances is maintained by the operator of the plants, Kosovo Energy Corporation (KEK), and that data is not publicly available in real time on the official air quality monitoring website. This prevents the citizens of Obiliq from being informed about air pollution in a proper and timely manner, which is why we chose this location for our first visit to Kosovo with our environmental dust monitor.
Independent monitoring of dust concentrations
We monitored dust concentrations for 26 days, from 7 February 2020 to 3 March 2020. The results were terrifying and showed a huge number of exceedances of the national and WHO daily limits for coarse (PM10) and fine (PM2.5) dust particles, with many of them several times higher than the limits.
The national legislation, just like the EU’s Air Quality Directive (AQD), sets a 50 µg/m³ daily limit for PM10 concentration that must not be exceeded on more than 35 days in a calendar year. This limit was exceeded on 17 of the 26 days monitored (Chart 1).
The highest recorded 24-hour average was 192 µg/m³ on 9 February, which is almost four times higher than the legal limit. The next highest averages were 179 µg/m³ on 17 February and 130 µg/m³ on 23 February. These levels of pollution are considered extremely hazardous to human health and the environment.
For PM2.5 particles, there is only a recommended daily limit by the WHO and there is no legal limit. The WHO recommends that 24-hour average PM2.5 concentrations should not be higher than 25 µg/m³ on more than three days in one calendar year. This limit was exceeded on 23 of the 26 days monitored (Chart 2).
Extremely high short-term pollution peaks
Even more concerning than these exceedances is the common occurrence of extremely high short-term peaks of PM10 pollution that last between 20 and 40 minutes. The highest short-term peaks were usually on the days that also had the highest 24-hour averages: 1,518 µg/m³ on 9 February, 1,632 µg/m³ on 17 February, 1,246 µg/m³ on 24 February, and 1,203 µg/m³ on 1 March. (see Charts 3-6)
Chart 3. One-minute PM10 values (green line) compared to the 24-hour legal limit value (red line), 9 February 2020
Chart 4. One-minute PM10 values (green line) compared to the 24-hour legal limit value (red line), 17 February 2020
Chart 5. One-minute PM10 values (green line) compared to the 24-hour legal limit value (red line), 24 February 2020
Chart 6. One-minute PM10 values (green line) compared to the 24-hour legal limit value (red line), 1 March 2020
Short-term emissions on other days were not typically this high, but they were often higher than 500 µg/m³. It is also hard to ignore that there is a pattern for these high pollution peaks. Most of them occur either after sunset, which during the monitoring period happened between 17.00 and 18.00, or around midnight. The possible reasons for this are discussed later in the analysis.
These short-term pollution peaks are not regulated by any legislation, but that does not mean they are not dangerous to human health. There is growing scientific evidence that even a slight short-term increase in dust concentrations can increase cardio-pulmonary mortality. This effect is additionally amplified in places like Obiliq, where air pollution is constantly high throughout the year.
What causes the peaks?
When the weather is calm, the dispersion of dust pollution is fairly limited to a small area or to vertical disposition. But pollution levels that are as high as the ones we recorded with our monitor cannot be traced back to a source that is in the immediate area of the monitoring device. In order to better understand what might be the cause of these pollution peaks, we include the wind direction in our analysis. The data set is then displayed as a pollution wind rose – a standard diagram in air pollution analysis that is used to determine the sources of high concentrations of pollutants. The coloured wedge segments represent the number of instances in which the pollution is coming from that direction, and the colours represent the different pollution concentrations in those instances as given on the scale. The transparent wedges represent the locations of three potential sources of high levels of pollution: Kosova A, located 1.5 kilometres south to south-east of the monitoring location; Kosova B, located 1.6 kilometres west to north-west; and the ash landfill for Kosova B, located 2.8 kilometres to the south.
The pollution wind roses for the days with the highest concentrations of PM10 particles clearly point to the Kosova A power plant and the ash disposal site for Kosova B as the general direction of the pollution’s source (Charts 7-10).
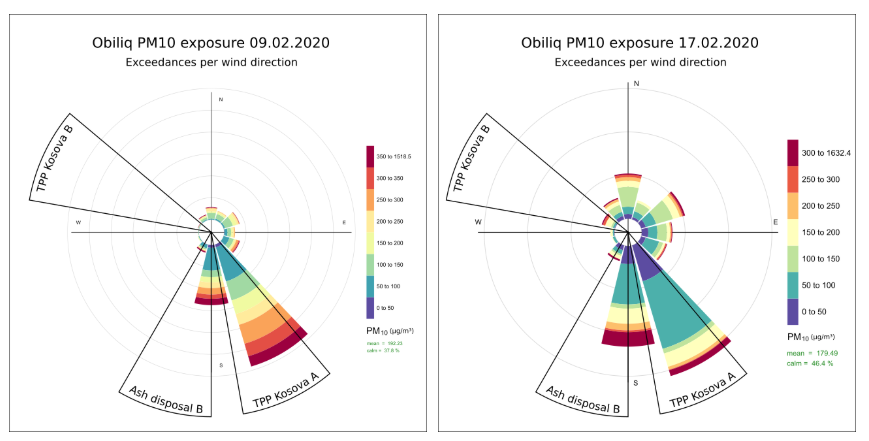
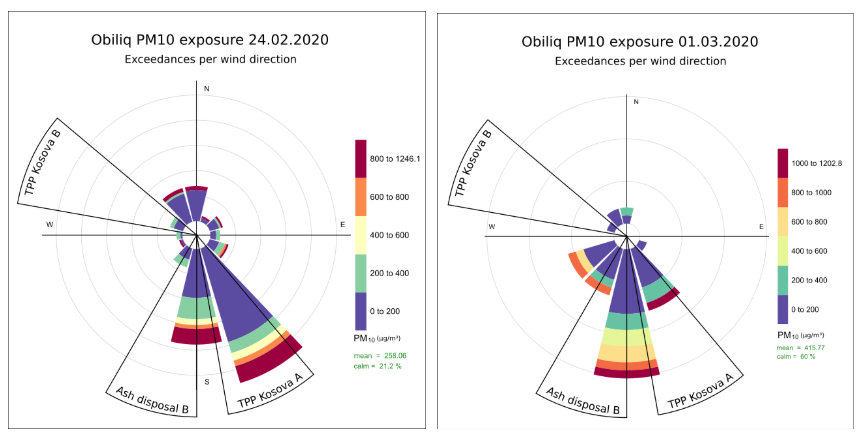
Charts 7-10. Pollution wind roses for the periods with the high pollution peaks in charts 3-6
Pollution peaks are scary, but they do not tell the whole story
Including wind direction in the analysis helps in identifying the direction of short bursts of high pollution, but it is not enough to determine the underlying cause of the continuous exceedances of the limit values. Wind can have different effects depending on its speed. Higher speeds can cause plumes from tall stacks to be brought down to ground-level or can increase particle suspension from facilities such as ash landfills and lignite storage, but they can also dilute the concentrations of the pollutants.
This is why the analysis must also take into account variations in wind speed to provide insightful information on different sources of pollution, not just the ones that cause the pollution peaks. Polar plots have gained popularity among the scientific community as a useful tool for quickly obtaining a graphical impression of how much potential sources influence the pollution levels at the monitoring location. The polar plot for our monitoring in Obiliq is displayed in Chart 11.
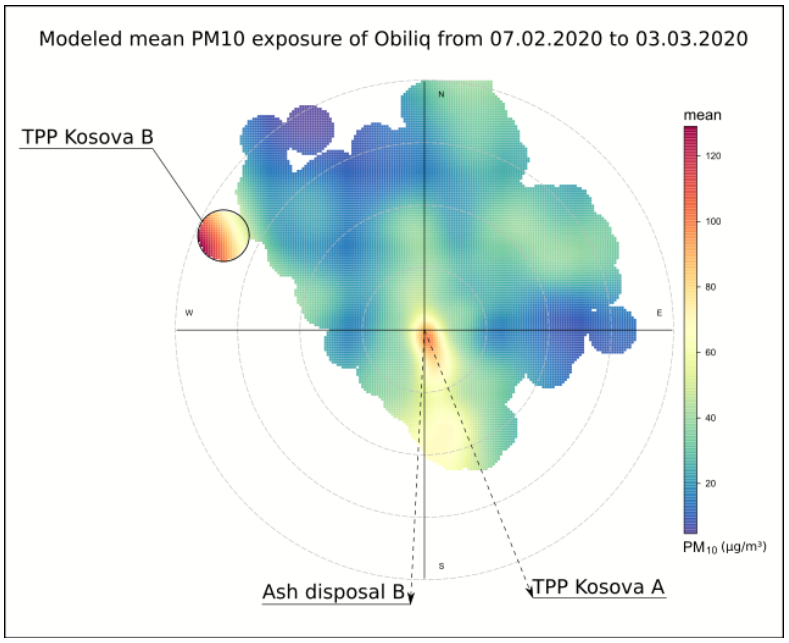
The dark red circle on the north-west coincides with Kosova B. According to this chart, that location is responsible for most of the pollution that creates long-term mean values higher than 100 µg/m³. The secondary source is pointing again in the general direction of Kosova A and the ash disposal site used for Kosova B.
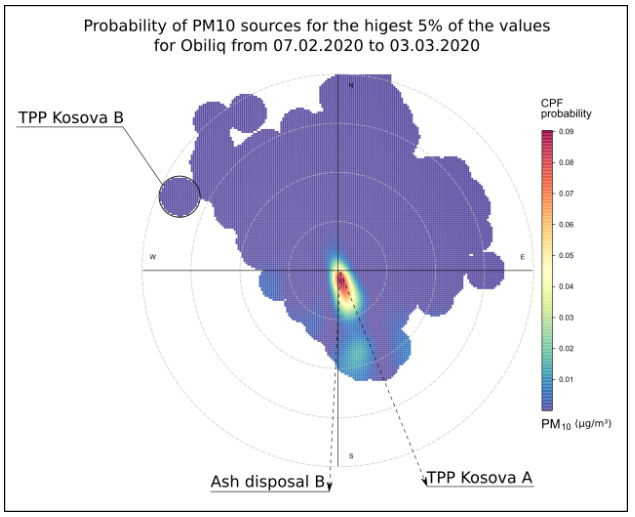
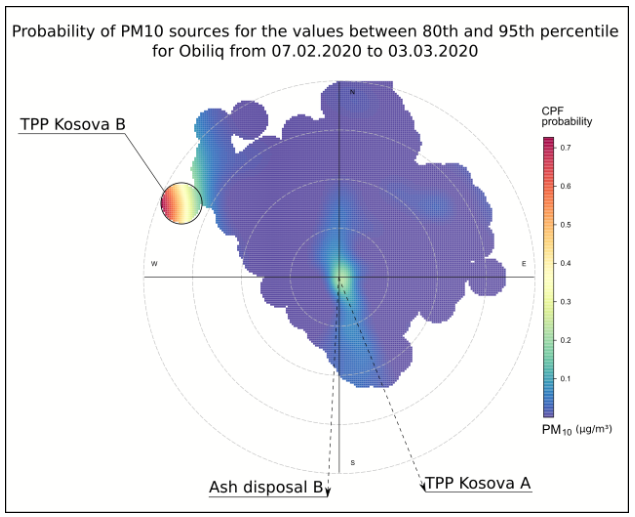
The suspicion that Kosova B, although not responsible for the high pollution peaks, causes a major amount of the pollution that creates the 24-hour exceedances can be proven by separately analysing the set of high pollution values (Chart 12) and the set of values that are in the range of the high 24-hour mean values (Chart 13). This is again displayed in a polar plot, but these plots show the probability of sources for different sets of pollution values as opposed to the mean pollution values as shown in Chart 11. Chart 12 confirms the findings from the pollution wind roses that the peaks originate from the general direction of Kosova A. Chart 13 shows the range of values that are between the 80 and 95 percentile of the collected values. Here it is obvious that all other sources have negligible contributions compared to that of the location of Kosova B.
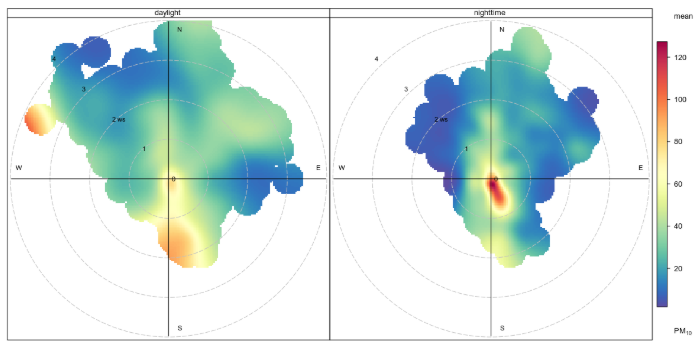
A similar distinction is also visible when the data is split between daytime and nighttime, which raises a long list of other questions that need to be additionally explored. We previously concluded that high pollution peaks occur after dark. This analysis shows that for some reason, during the night, the direction of Kosova A is a source of extremely high concentrations of dust particles that may be causing these peaks. This might be because of meteorological conditions where winds with higher speed occur more often during the night and bring more particles from that side, but it may also be due to some foul play in the power plant. This power plant already has installed and functioning dust filters and should not be a source of such high pollution levels. However, we witnessed a similar situation in Tuzla, Bosnia and Herzegovina. In that case, one possible reason for high nighttime pollution was that the plant’s dust filters were allegedly turned off at night to increase its electricity output.
What needs to be done
In just one month of indicative monitoring, we have gathered large amounts of evidence demonstrating the ways the coal facilities are detrimental to the air quality in Obiliq. This should serve as a basis for further research and as a call to the authorities to provide real-time measurements to the local population.
Installing continuous monitoring of emissions at both power plants, with information available in real time, and combining this data with the outdoor air quality data will provide further insight on the reasons for the day/night differences in pollution.
The lack of dust filters in Kosova B is expected to be addressed soon, with a recently launched EU-funded project to improve the environmental performance of the plant. The installation of dust filters should reduce dust emissions by 35 times. However, in order to protect public health and the environment, Kosova B needs to reduce its operating hours until the retrofit is ready.
At the same time, depleted lignite mines must be recultivated to stop dust from being carried by the wind. The same applies to ash disposal sites that are already at full capacity, such as the one next to Kosova A.
The energy system in Kosovo is almost completely reliant on fossil fuels, and this needs to be remedied as soon as possible. The country needs a clear plan to steer away from coal in the coming years. Projects aimed at increasing renewable electricity generation and non-coal based heating capacities must be sped up for the energy transition to take place.
